Image Details
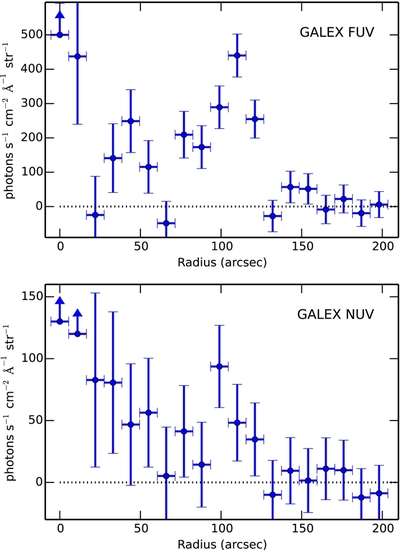
Caption: Figure 2.
FUV (top panel) and NUV (bottom panel) background-subtracted surface brightness radial profiles. Surface brightness axis is limited to highlight the extended emission near ~100'', bins closest to the central point source emission are indicated with upward pointing arrows because their emission lies beyond the plot range.
Other Images in This Article

Copyright and Terms & Conditions
© 2015. The American Astronomical Society. All rights reserved.
Copyright ©
2026 Astronomy Image Explorer. All Rights Reserved.