Image Details
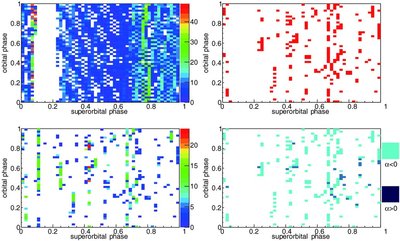
Caption: Figure 2.
GBI (upper left) and INTEGRAL (bottom left) data distribution in orbital/superorbital phase space. The number of observations is given by the color scale. The upper right panel shows the phase space in which the GBI and INTEGRAL observations overlap. The radio index of the overlapped INTEGRAL and GBI observations are shown in the bottom right panel (light blue represents α < 0; dark blue represents α > 0).
Other Images in This Article
Copyright and Terms & Conditions
© 2014. The American Astronomical Society. All rights reserved.
Copyright ©
2026 Astronomy Image Explorer. All Rights Reserved.