Image Details

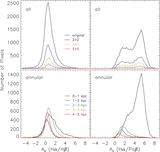
Caption: Figure 4.
Left. the relation between A V derived in two ways, compared to the five simple models discussed in the text, numbered in the same fashion (1—foreground screen; 2—clumpy dust screen; 3—uniform scattering slab; 4—clumpy scattering slab; 5—uniform mixture). Only pixels with S/N ⩾ 5 detection in all three lines are used, and the typical 1σ uncertainty is shown at the corner. The blue line A V (Hα/Paβ) = 1.428 A V (Hα/Hβ) bisects the data points and approximately separates the two branches which roughly follow either model 5 or the degenerate trend of the other four models. When averaged over ~180 pc (i.e., a 30 × 30 grid), all data points become consistent with model 1. Right. the ratio of the area occupied by the "uniform mixture branch" to that by the "foreground screen branch" as a function of the galactocentric distance. The central region within ~2 kpc is dominated by "uniform mixture" pixels (61%) and thus favors model 5, while the rest of the disk is dominated by "foreground screen" pixels (66%) and favors model 1 better.
Other Images in This Article
Copyright and Terms & Conditions
© 2013. The American Astronomical Society. All rights reserved.