

Image Details
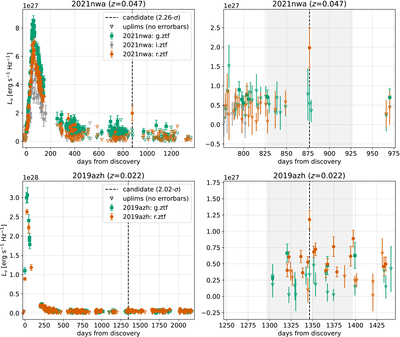
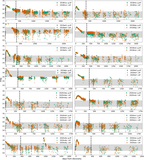
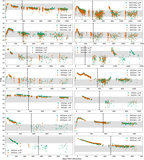
Caption: Figure 5.
The two highest-significance candidates found in our analysis, from AT 2019azh and AT 2021nwa. The left panels show the full light curve, while the right panels show that at ±100 days around the candidate. Shaded regions show the temporal regions used in our search for the flux comparison.
Other Images in This Article
Copyright and Terms & Conditions
© 2026. The Author(s). Published by the American Astronomical Society.

Copyright ©
2026 Astronomy Image Explorer. All Rights Reserved.
