

Image Details
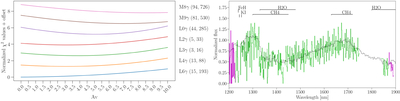
Caption: Figure 1.
Left: χ2 values for the comparison of the smoothed J0541 Euclid spectrum with young templates at different AV values. The χ2 values are normalized between each template minimum and maximum, which are written next to the template spectral type. Right: the Euclid spectrum of J0541 dereddened for AV = 3 mag compared to an L3γ template. The spectrum is plotted by green and magenta lines, the latter corresponding to wavelengths of low grism transmission. No line is plotted where the spectrum is contaminated by artifacts. The L3γ template (2MASSW J2208136+292121; J. Gagné et al. 2015) is plotted by the black line. The J0541 Euclid spectrum is available as the data behind the figure.
(The data used to create this figure are available in the online article.)
(The data used to create this figure are available.)
Other Images in This Article
Copyright and Terms & Conditions
© 2026. The Author(s). Published by the American Astronomical Society.

