

Image Details
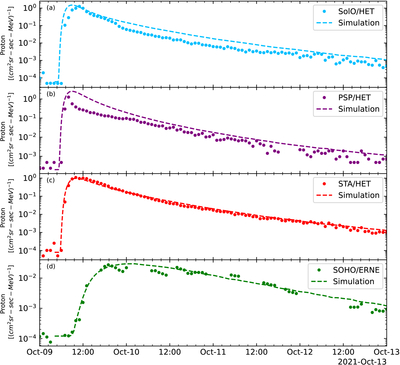
Caption: Figure 12.
Comparison between observed and simulated proton flux profiles for the 2021 October 9 SEP event at SolO, PSP, STA, and SOHO. The observation and simulation curves are distinguished by the line styles indicated in each panel.
Other Images in This Article
Show More
Copyright and Terms & Conditions
© 2026. The Author(s). Published by the American Astronomical Society.

Copyright ©
2026 Astronomy Image Explorer. All Rights Reserved.
