

Image Details
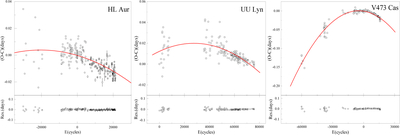
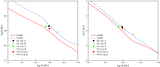
Caption: Figure 2.
The O − C diagrams of three binary systems. The O − C values of these targets are calculated using the linear ephemeris listed in Equations (1)–(3). The red dashed lines indicate the quadratic fit, and open cycles stand for the observed data. The final fitting residuals are plotted in the bottom panel.
Other Images in This Article
Copyright and Terms & Conditions
© 2026. The Author(s). Published by the American Astronomical Society.

Copyright ©
2026 Astronomy Image Explorer. All Rights Reserved.
