

Image Details
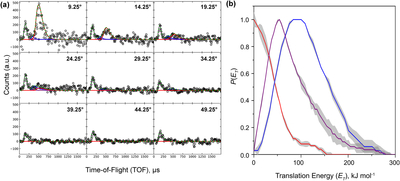
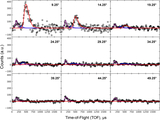
Caption: Figure 4.
(a) TOF spectra recorded at laboratory angles from 9﹩\mathop{.}\limits^{^\circ }﹩25 to 49﹩\mathop{.}\limits^{^\circ }﹩25 for the C2H2/CCH2 loss channel (m/z = 26) in the 193 nm photodissociation of vinylacetylene (C4H4). Open circles represent the experimental data. The green dotted line corresponds to the best-fit forward-convolution simulation, while the red, blue, and purple curves (solid lines) denote the individual contributions from dissociative ionization of the H loss channel (m/z = 51), H2 loss channel (m/z = 50), and the true C2H2/CCH2 loss channel, respectively. (b) Center-of-mass translational energy distributions, P(ET), for the H loss (red), H2 loss (blue), and C2H2/CCH2 loss (purple) channels derived from the best-fit simulations. The shaded regions indicate the uncertainties in the fits.
Other Images in This Article
Copyright and Terms & Conditions
© 2026. The Author(s). Published by the American Astronomical Society.

