

Image Details
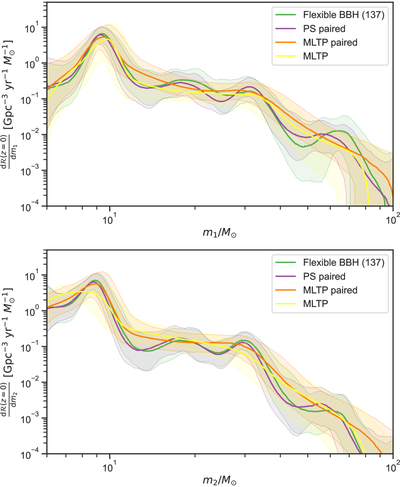
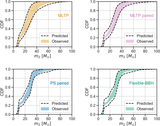
Caption: Figure B2.
Inferred mass distributions of primary and secondary BHs under the Flexible-BBH, PS-paired, MLTP-paired, and MLTP models. Solid lines and shaded areas represent median values and 90% credible intervals, respectively. The MLTP model fails to capture the peaks at ∼10 M⊙ and ∼30 M⊙ in the secondary-mass distribution.
Other Images in This Article
Copyright and Terms & Conditions
© 2026. The Author(s). Published by the American Astronomical Society.

Copyright ©
2026 Astronomy Image Explorer. All Rights Reserved.
