

Image Details
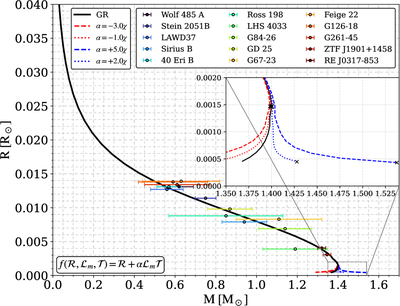
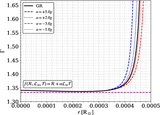
Caption: Figure 3.
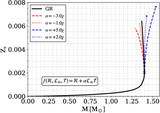
M–R plot for WDs within the nonlinear ﹩f({ \mathcal R },{{ \mathcal L }}_{m},{ \mathcal T })﹩ gravity model. The solid black curve represents the GR prediction, whereas the colored curves correspond to the dimensionless coupling parameter values α ranging from −3χ to +5χ with χ = 106.
Other Images in This Article
Copyright and Terms & Conditions
© 2026. The Author(s). Published by the American Astronomical Society.

Copyright ©
2026 Astronomy Image Explorer. All Rights Reserved.
