

Image Details
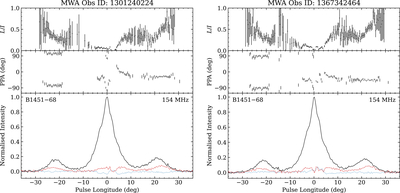
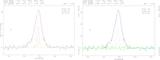
Caption: Figure B1.
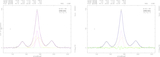
Polarimetric pulse profiles for B1451−68 from the two MWA observation epochs in the 140–170 MHz band. The bottom panels show the normalized total intensity profile (black solid line), linear polarization (red dashed line), and circular polarization (blue dotted line). The middle panels show the PPA for phase bins where the linear polarization exceeds 3σ, where σ is the standard deviation of the offpulse noise. The top panels show the fractional degree of linear polarization L/I.
Other Images in This Article
Show More
Copyright and Terms & Conditions
© 2026. The Author(s). Published by the American Astronomical Society.

Copyright ©
2026 Astronomy Image Explorer. All Rights Reserved.
