

Image Details
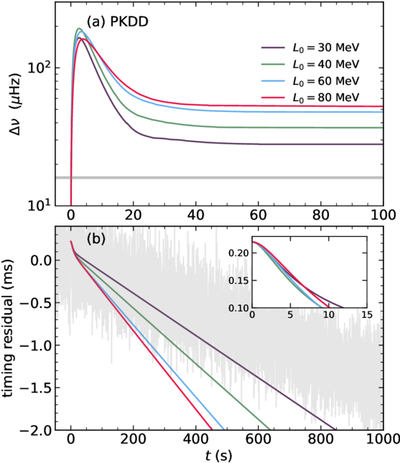
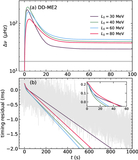
Caption: Figure 4.
Glitch rise dynamics for different L0 values using the PKDD interaction. (a) Temporal evolution of the crustal frequency shift Δν, showing an overshoot whose peak and timing depend on L0. The gray line indicates the final glitch step size 16.02 μHz (J. Palfreyman et al. 2018). (b) Corresponding model timing residuals compared to observations from J. Palfreyman et al. (2018) and V. Graber et al. (2018). The inset highlights the first 15 s, demonstrating the model’s sensitivity to L0 during the initial rise.
Other Images in This Article
Copyright and Terms & Conditions
© 2026. The Author(s). Published by the American Astronomical Society.

Copyright ©
2026 Astronomy Image Explorer. All Rights Reserved.
