

Image Details
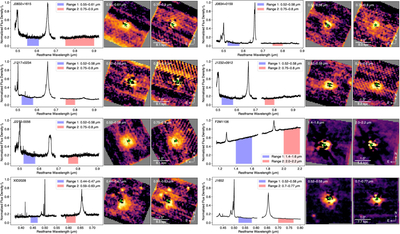
Caption: Figure 2.
Total spectra and wavelength-average quasar-subtracted images of the eight targets. The left panel of each target shows the total spectrum with shaded regions, which represent the wavelength ranges used for the images. The right two panels show wavelength-average images after PSF subtraction. The green stars represent the quasar locations. The north is up and the east to the left.
Other Images in This Article
Copyright and Terms & Conditions
© 2026. The Author(s). Published by the American Astronomical Society.

Copyright ©
2026 Astronomy Image Explorer. All Rights Reserved.
