

Image Details
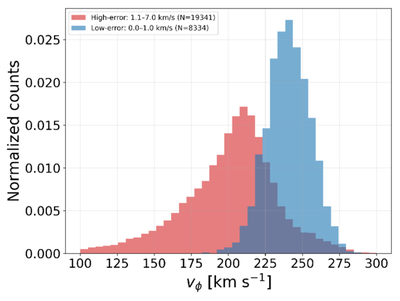
Caption: Figure 3.
Comparison of the azimuthal velocity distributions vϕ for stars in the bin 9 < R < 11 kpc and 1 < ∣z∣ < 2 kpc, separated according to their velocity measurement uncertainties σ(vϕ). Stars with small uncertainties, i.e., 0 < σ(vϕ) < 1 km s−1 (blue distribution), show a peak at vϕ ≈ 250 km s−1, whereas stars with larger uncertainties, i.e., 1.1 < σ(vϕ) < 7 km s−1 (red distribution), show a peak at vϕ ≈ 200 km s−1.
Other Images in This Article

Copyright and Terms & Conditions
© 2026. The Author(s). Published by the American Astronomical Society.

Copyright ©
2026 Astronomy Image Explorer. All Rights Reserved.
