

Image Details
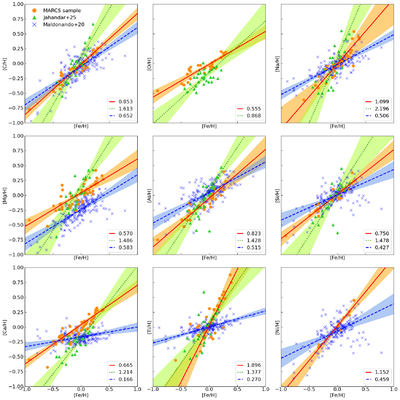
Caption: Figure B1.
Comparison of M dwarf abundances for our benchmark sample consisting of surveys using the MARCS model atmosphere (orange) to those from J. Maldonado et al. (2020) (blue) and F. Jahandar et al. (2025) (green). The median slopes derived from the ODR are shown in the legend of each panel.
Other Images in This Article
Copyright and Terms & Conditions
© 2026. The Author(s). Published by the American Astronomical Society.

Copyright ©
2026 Astronomy Image Explorer. All Rights Reserved.
