Image Details
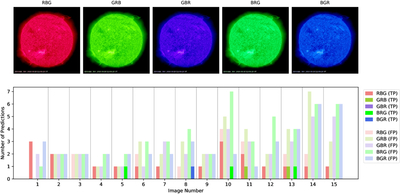
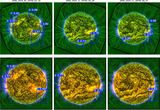
Caption: Figure 3.
Top: example images for testing color bias showing the different RGB channel permutation (from left to right): RBG, GRB, GBR, BRG, BGR. Bottom: bar chart showing the number of predictions per image when testing inference on each of the five permutation types above. The bars are segmented between true positives (darker shades) and false positives (lighter shades).
Other Images in This Article
Copyright and Terms & Conditions
© 2026. The Author(s). Published by the American Astronomical Society.
Copyright ©
2026 Astronomy Image Explorer. All Rights Reserved.