Image Details
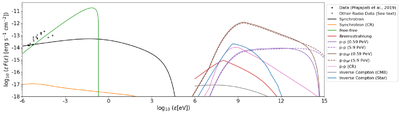
Caption: Figure 3.
Computed multiwavelength SED. Observed data are shown as black dots; radio data from P. Prajapati et al. (2019) are represented by filled black dots, while other radio data from the literature (D. A. Green 2022) are shown as open circles. The synchrotron contribution is shown in black. The contributions from free–free emission (green), relativistic bremsstrahlung (red), and inverse Compton (from the CMB in gray and from the star in light blue) are also shown. The emission from protons at the reverse shock is shown in purple and at the shell in brown, for two maximum energies: 0.6 PeV (solid) and 6 PeV (dashed). The synchrotron emission from cosmic-ray electrons (orange) and p − p from protons (pink) interacting in the shell are also shown.
Other Images in This Article
Copyright and Terms & Conditions
© 2026. The Author(s). Published by the American Astronomical Society.