Image Details
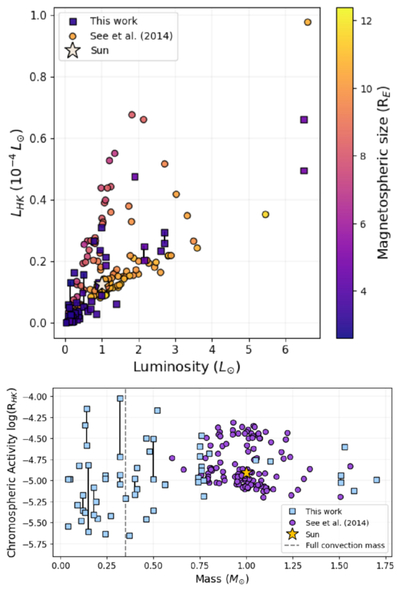
Caption: Figure 6.
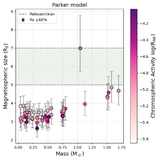
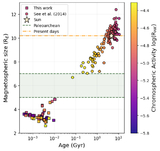
Upper panel: Ca II H and K line luminosities vs. bolometric luminosity, color coded by planetary magnetosphere size for the E. N. Parker (1958) model. Lower panel: chromospheric activity as a function of stellar mass, where the dashed line represents the fully convective limit of 0.35 M⊙. Both panels consider WTTS data and solar-type stars from V. See et al. (2014).
Other Images in This Article
Copyright and Terms & Conditions
© 2026. The Author(s). Published by the American Astronomical Society.
Copyright ©
2026 Astronomy Image Explorer. All Rights Reserved.