Image Details
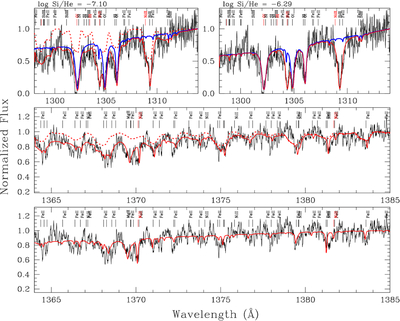
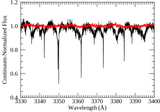
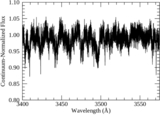
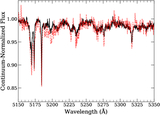
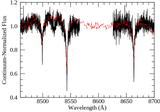
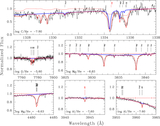
Caption: Figure 12.
Top left: photospheric fit (red) of silicon lines in the UV, including the circumstellar disk (dotted red). Top right: traditional photospheric fit (red) of silicon lines in the UV. The obtained Si abundance with (left) and without (right) including the disk is presented in the top two panels. The blue line represents the photosphere without silicon. Bottom: selected region of the UV with and without the contribution of the disk (dotted red) to the continuum. The rest wavelengths of the OI lines in the top two panels are 1302.17, 1304.86, and 1306.03.
Other Images in This Article
Show More
Copyright and Terms & Conditions
© 2026. The Author(s). Published by the American Astronomical Society.
Copyright ©
2026 Astronomy Image Explorer. All Rights Reserved.