Image Details
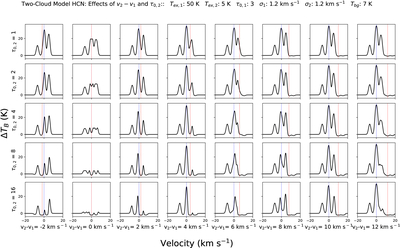
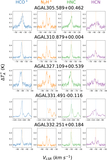
Caption: Figure 24.
Simulated line profiles of HCN (1–0) in a simple two-cloud model. The blue vertical lines represent the velocity of the warm background cloud and the red vertical lines the velocity of the cold foreground cloud. The profiles show a grid of various foreground cloud optical depths and velocity offsets, with foreground cloud optical depth ranging from 1 to 16, varying by factors of 2 (y-direction) and offset velocities V2 − V1 ranging from −2 to 12 km s−1, in steps of 2 km s−1 (x-direction). Parameters for this particular model are shown in the title. The rightmost F = 1 → 1 hyperfine line in the background cloud is suppressed by self-absorption by the main F = 2 → 1 hyperfine line in the foreground cloud for large foreground optical depths and velocity offsets of ∼2–8 km s−1, shown in the lower-middle panels in the plot.
Other Images in This Article
Show More
Copyright and Terms & Conditions
© 2026. The Author(s). Published by the American Astronomical Society.