Image Details
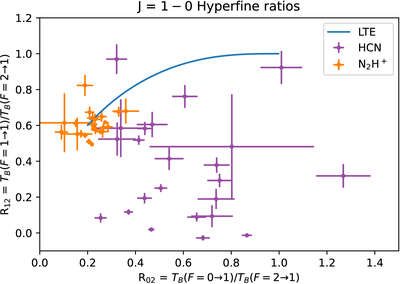
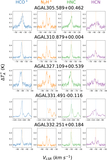
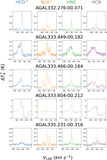
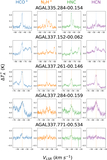
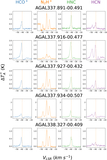
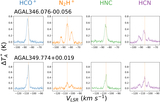
Caption: Figure 23.
The observed hyperfine intensity ratios and their uncertainties for HCN (1–0) and N2H+ (1–0). The solid line represents the locus of LTE ratios for various optical depths, with optically thin ratios (0.2, 0.6) at the lower left, and optically thick ratios (1.0, 1.0) at the upper right.
Other Images in This Article
Show More
Copyright and Terms & Conditions
© 2026. The Author(s). Published by the American Astronomical Society.
Copyright ©
2026 Astronomy Image Explorer. All Rights Reserved.