Image Details
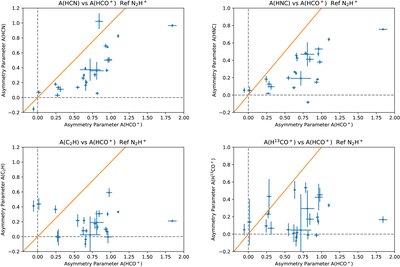
Caption: Figure 22.
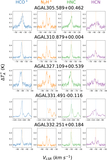
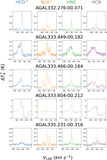
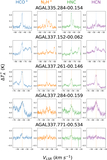
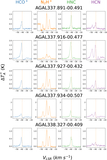
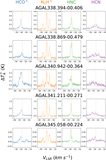
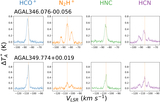
Top left: the asymmetry parameter A for HCN (1–0) versus the asymmetry parameter A for HCO+ (1–0), using N2H+ (1–0) as the reference line. Top right: the asymmetry parameter A for HNC (1–0) versus the asymmetry parameter A for HCO+ (1–0), using N2H+ (1–0) as the reference line. Bottom left: the asymmetry parameter A for C2H (N = 1–0; J = 3/2–1/2; F = 2–1), versus the asymmetry parameter A for HCO+ (1–0), using N2H+ (1–0) as the reference line. Bottom right: the asymmetry parameter A for H13CO+ (1–0) versus the asymmetry parameter A for HCO+ (1–0), using N2H+ (1–0) as the reference line. For all plots, the orange diagonal line represents equal values of A for both lines. The dotted gray lines indicate values of A = 0 for both lines. The plotted uncertainties are σtot, as described in the text. All of these lines typically have positive values for A. The largest values of A occur for HCO+. As the optical depth decreases, the values of A also decrease.
Other Images in This Article
Show More
Copyright and Terms & Conditions
© 2026. The Author(s). Published by the American Astronomical Society.