Image Details
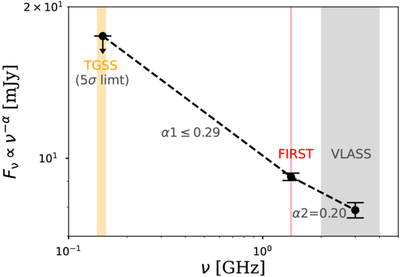
Caption: Figure 3.
Radio SED of J1406+0102. α1 (α2) represents the spectral index calculated between the TGSS and FIRST data (and between FIRST and VLASS), respectively. The shaded region corresponds to the bandwidth of each survey, as summarized in Table 3.
Other Images in This Article
Copyright and Terms & Conditions
© 2025. The Author(s). Published by the American Astronomical Society.
Copyright ©
2025 Astronomy Image Explorer. All Rights Reserved.