Image Details
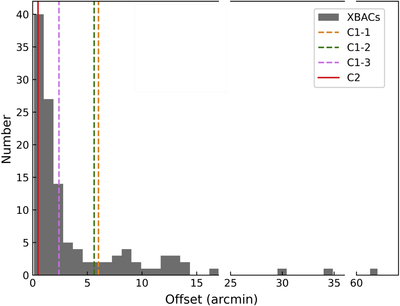
Caption: Figure 7.
Distribution of the offsets between the optical and X-ray centers for 120 Abell clusters in the XBACs catalog. The offsets between the brightest galaxies and X-ray centers for C1 and C2 are shown as the solid magenta line and the dotted red line, respectively.
Other Images in This Article

Copyright and Terms & Conditions
© 2022. The Author(s). Published by the American Astronomical Society.
Copyright ©
2026 Astronomy Image Explorer. All Rights Reserved.