Image Details
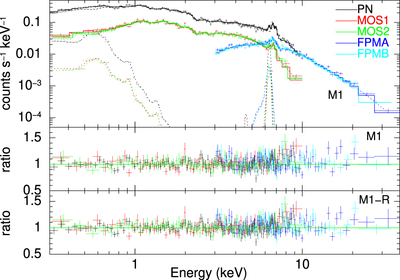
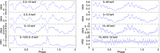
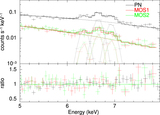
Caption: Figure 7.
The top and middle panels show the plots of the best-fit model and ratio (data/model) for the broadband spectra using model variant M1. We In the bottom panel we show the ratio plot using the “reflect” version of model M1, i.e., M1-R.
Other Images in This Article
Copyright and Terms & Conditions
© 2022. The Author(s). Published by the American Astronomical Society.
Copyright ©
2026 Astronomy Image Explorer. All Rights Reserved.