Image Details
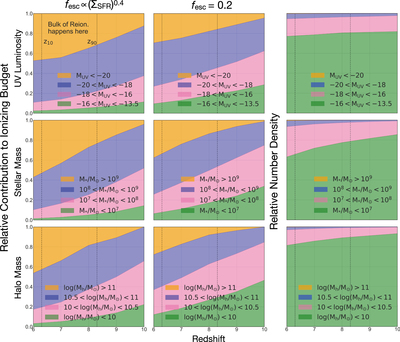
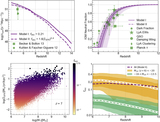
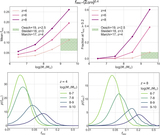
Caption: Figure 9.
Which galaxies reionized the universe? The top, middle, and bottom panels show groupings of galaxies by MUV (observed), stellar mass, and halo mass, respectively. The left and center columns are shaded by the relative contribution of each group to the total ionizing budget (﹩{\dot{n}}_{\mathrm{ion}}﹩) as per our two models for ﹩{f}_{\mathrm{esc}}﹩. The right-most column is colored by the relative number-density of each group. The black dotted lines in each panel sandwich the redshift-space when the universe is inferred to go from 90% (z90) to 10% neutral (z10). In the central panel, the reionization budget is essentially a reflection of our predicted UVLF, since ξion does not vary strongly with luminosity and ﹩{f}_{\mathrm{esc}}﹩ is constant, while in the left panel the ﹩{f}_{\mathrm{esc}}﹩ ∝ ﹩{{\rm{\Sigma }}}_{\mathrm{SFR}}﹩ model further down-weights the contribution of faint galaxies. UV-bright and massive sources represented in orange and blue dominate the reionization budget (≳50%–80%), despite comprising ≲5% of the population. This scenario, “reionization by oligarchs,” stands in stark contrast to the canonical “democratic reionization” led by copious faint sources.
Other Images in This Article
Show More
Copyright and Terms & Conditions
© 2020. The American Astronomical Society. All rights reserved.