Image Details
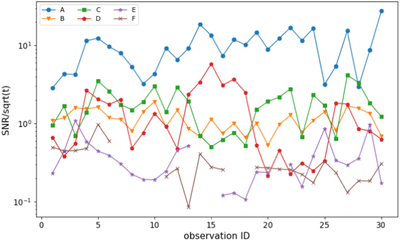
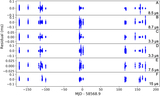
Caption: Figure 9.
S/N variations of the six pulsars in M13. The x-axis is observation ID; long observations are marked with several observation IDs so that the data in each observation ID have similar integration times. The y-axis is S/N divided by ﹩\sqrt{t}﹩. t is the integration time of data in each observation ID.
Other Images in This Article
Copyright and Terms & Conditions
© 2020. The American Astronomical Society. All rights reserved.
Copyright ©
2026 Astronomy Image Explorer. All Rights Reserved.