Image Details
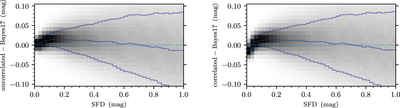
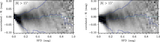
Caption: Figure 10.
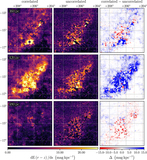
Histogram of the residuals of our new map with Bayestar17, as a function of the SFD reddening. Both maps are integrated to infinite distance. The left panel compares our uncorrelated map (initial iteration) with Bayestar17, while the right panel compares our correlated map (final iteration) with Bayestar17. All reddenings are in magnitudes of ﹩E\left(g-r\right)﹩.
Other Images in This Article

Show More
Copyright and Terms & Conditions
© 2019. The American Astronomical Society. All rights reserved.
Copyright ©
2026 Astronomy Image Explorer. All Rights Reserved.