Image Details
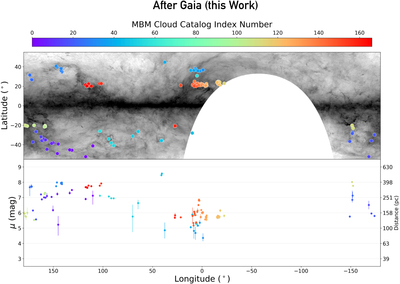
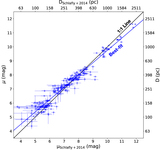
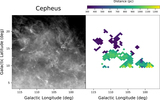
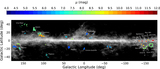
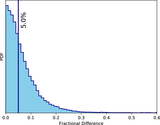
Caption: Figure 5.
Same as in Figure 4, except now showing the MBM clouds, with sightlines color-coded according to their cloud index from MBM. An interactive version of this figure showing the differences before and after Gaia is available at https://faun.rc.fas.harvard.edu/czucker/Paper_Figures/mbmcloud_html_final.html in the online version of the published article.
An interactive version of this figure is available in the online journal.
Other Images in This Article

Copyright and Terms & Conditions
© 2019. The American Astronomical Society. All rights reserved.
Copyright ©
2026 Astronomy Image Explorer. All Rights Reserved.