Image Details
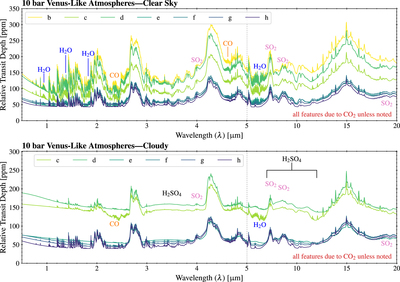
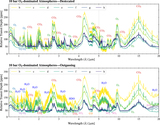
Caption: Figure 10.
Simulated transit transmission spectra for the Venus-like clear-sky (upper panel) and cloudy (lower panel) atmospheres. The y axes are the relative transit depths and show the modeled atmospheric signal. We show only 10 bar atmospheres, as the 92 bar atmospheres are quantitatively similar. All unlabeled features are CO2, which dominate these spectra. The generally flat, higher transit depths of the cloudy Venus-like spectra are due to the sulfuric acid aerosols. TRAPPIST-1 b is not included because it did not condense H2SO4 in our model. The colder cloudy atmospheres have lower cloud decks (see Figure 6), revealing deeper relative transit depths.
Other Images in This Article
Show More
Copyright and Terms & Conditions
© 2018. The American Astronomical Society.