Image Details
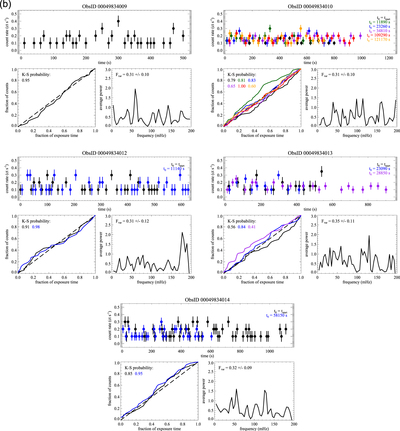
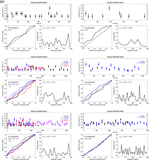
Caption: Figure 5.
(a) Timing analysis plots for the Swift/XRT observations. The top panel shows the 0.3–10 keV light curve. The bottom left panel shows the photon arrival time (solid line) vs. the expectation for a constant count rate (dashed line), used to calculate the K-S probability of non-variability. (b) The bottom right panel shows the 3–200 mHz periodogram, used to calculate Fvar (see the text for details).
Other Images in This Article
Copyright and Terms & Conditions
© 2018. The American Astronomical Society. All rights reserved.
Copyright ©
2026 Astronomy Image Explorer. All Rights Reserved.