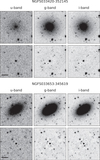
Image Details
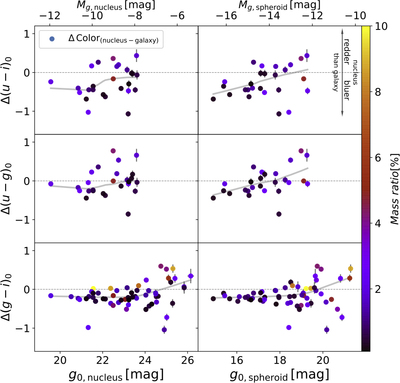
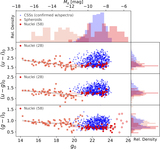
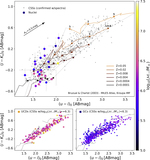
Caption: Figure 9.
Color differences between the nucleus and its host dwarf galaxy spheroid in Δ(u′ − i′)0, Δ(u′ − g′)0, and Δ(g′ − i′)0 (top to bottom panels) vs. g0,nucleus (right panels) and vs. g0,spheroid (left panels). The color code of the symbols shows the corresponding nucleus-to-galaxy mass ratio encoded by the vertical color bar. The gray curves represent LOWESS fits to the data. The arrows in the top panel show the directions in which the nucleus becomes redder or bluer than its host galaxy. Note that photometric errors are for most data points smaller than the symbol size.
Other Images in This Article
Show More
Copyright and Terms & Conditions
© 2018. The American Astronomical Society. All rights reserved.
Copyright ©
2026 Astronomy Image Explorer. All Rights Reserved.