Image Details
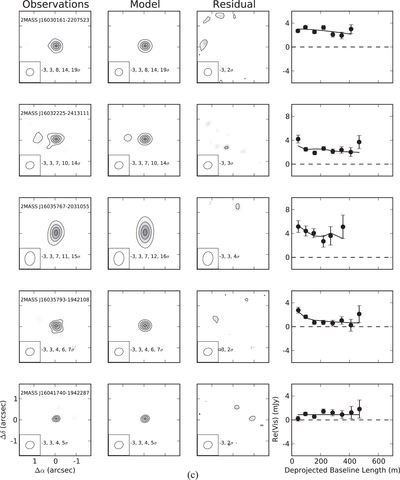
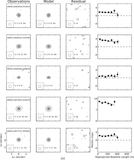
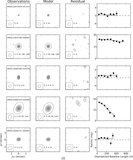
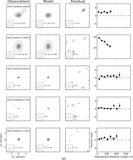
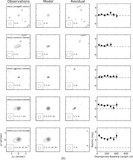
Caption: Figure 1.
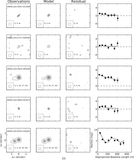
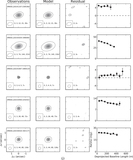
ALMA 0.88 mm observed, model, and residual images corresponding to the best-fit dust model parameters for each source. The real part of the deprojected visibilities for the observations (solid points) and best-fit model (solid curve) are also shown as a function of baseline length.
1 of 10 images
Other Images in This Article
Show More
Copyright and Terms & Conditions
© 2017. The American Astronomical Society. All rights reserved.
Copyright ©
2025 Astronomy Image Explorer. All Rights Reserved.