Image Details
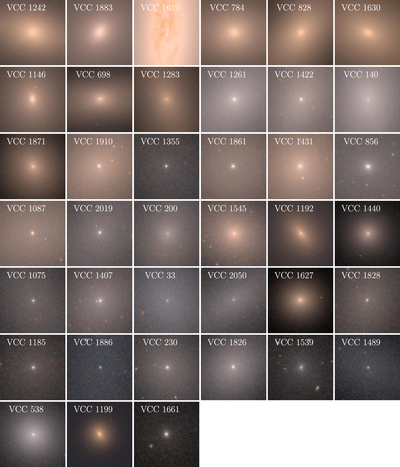
Caption: Figure 5.
HST color images focusing on the central 20″ × 20″ (﹩1.6\times 1.6﹩ kpc) region of each program galaxy, sorted by decreasing F475W luminosity. In all images, north is up and east is to the left.
Other Images in This Article


Show More
Copyright and Terms & Conditions
© 2017. The American Astronomical Society. All rights reserved.
Copyright ©
2026 Astronomy Image Explorer. All Rights Reserved.