Image Details
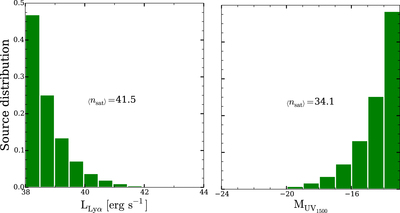
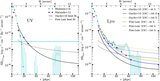
Caption: Figure 7.
Distribution of luminosities for satellite sources in the range ﹩10\leqslant r\leqslant 160\,\mathrm{pkpc}﹩ from the central LAE, using the parameters in Table 1 and our fiducial clustering model. The left panel represents the distribution of Lyα luminosities and the right panel those of UV magnitudes. Every panel quotes the average number of galaxies obtained from Equation (10). Both panels indicate the presence of a few sources close to the observational thresholds, and a larger number of significantly fainter objects.
Other Images in This Article
Copyright and Terms & Conditions
© 2017. The American Astronomical Society. All rights reserved.
Copyright ©
2026 Astronomy Image Explorer. All Rights Reserved.