Image Details
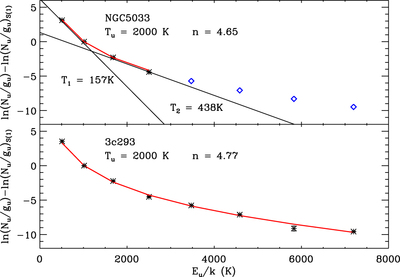
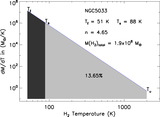
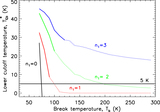
Caption: Figure 1.
Excitation diagram for NGC 5033 and 3c 293. The Nu/gu ratios are normalized with respect to the S(1) transition. The solid red line indicates our model fit to the observed normalized columns, denoted by black points. The error bars on the black points are comparable to the symbol sizes. The resulting model parameters Tu, and n are indicated. The two solid lines show the two discrete temperature fit adopted by Roussel et al. (2007). The blue diamonds show model-predicted ratio values for the (unobserved) S(4)–S(7) ﹩{{\rm{H}}}_{2}﹩ rotational lines in NGC 5033. The lower panel for 3c 293 shows our model fit to all the MIR rotational lines S(0)–S(7) detected with the Spitzer/IRS. The radio jets in 3c293 shock-excite ﹩{{\rm{H}}}_{2}﹩ to high energy levels resulting in high rotational line fluxes. A single power-law model, varying only slope, reproduces ﹩{{\rm{H}}}_{2}﹩ excitation across a wide range of excitation energy.
Other Images in This Article
Show More
Copyright and Terms & Conditions
© 2016. The American Astronomical Society. All rights reserved.