Image Details
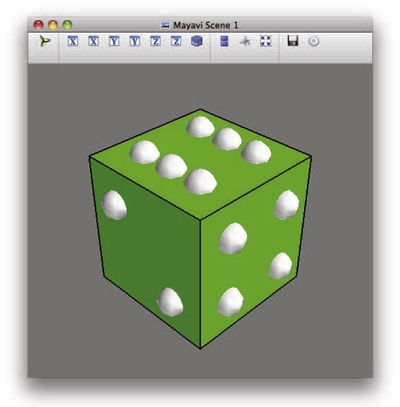
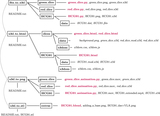
Caption: Figure 2.
Green (top) and red (bottom) dice used to demonstrate how to implement the X3D pathway. These models complement the more realistic example of the VLA observations of the H I gas inside HCG 91 by providing two additional examples of incremental complexity. An interactive version of these diagrams is accessible online as an interactive HTML document.
An interactive version of this figure is available in the online journal.
Other Images in This Article


Copyright and Terms & Conditions
© 2016. The American Astronomical Society. All rights reserved.
Copyright ©
2026 Astronomy Image Explorer. All Rights Reserved.