Image Details
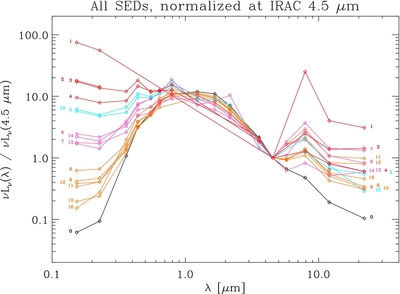
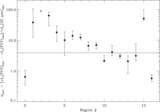
Caption: Figure 3.
SEDs of all regions normalized by their Spitzer 4.5 μm intensity. They are illustrated in the color-code defined in Section 3.1. Region numbers are shown accompanying the beginning and end points of the SEDs.
Other Images in This Article
Copyright and Terms & Conditions
© 2014. The American Astronomical Society. All rights reserved.
Copyright ©
2025 Astronomy Image Explorer. All Rights Reserved.