Image Details
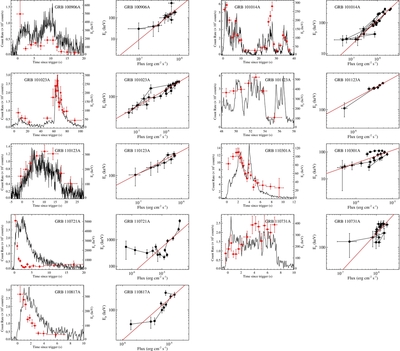
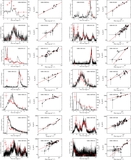
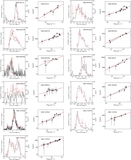
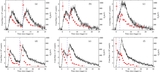
Caption: Figure 2.
Left: light curves (connected lines) presented along with the E p evolution (circles with error bars) of the long GRBs in our sample. Right: time-resolved E p as a function of flux, along with the best-fit line for the E p − F correlation for the long GRBs in our sample.
Other Images in This Article
Show More
Copyright and Terms & Conditions
© 2012. The American Astronomical Society. All rights reserved.
Copyright ©
2026 Astronomy Image Explorer. All Rights Reserved.