Image Details
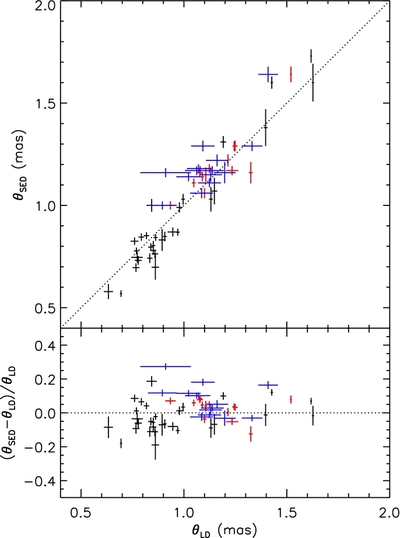
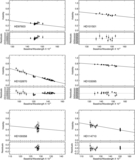
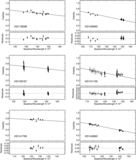
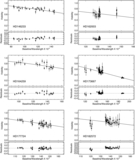
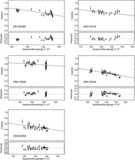
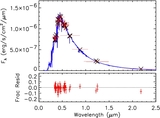
Caption: Figure 2.
Top: plot showing the measured limb-darkened angular diameters vs. the SED angular diameters and the 1σ errors (black). Measurements for the 14 stars in common with this work are highlighted in color with red indicating a CHARA measurement presented in this paper and blue for a PTI measurement measured in van Belle & von Braun (2009). Bottom: plot showing the fractional difference between the SED and limb-darkened angular diameters. The dotted line shows an equal agreement of both measurements. See Section 3.2 and Tables 5 and 6 for details.
Other Images in This Article
Show More
Copyright and Terms & Conditions
© 2012. The American Astronomical Society. All rights reserved.
Copyright ©
2026 Astronomy Image Explorer. All Rights Reserved.