Image Details
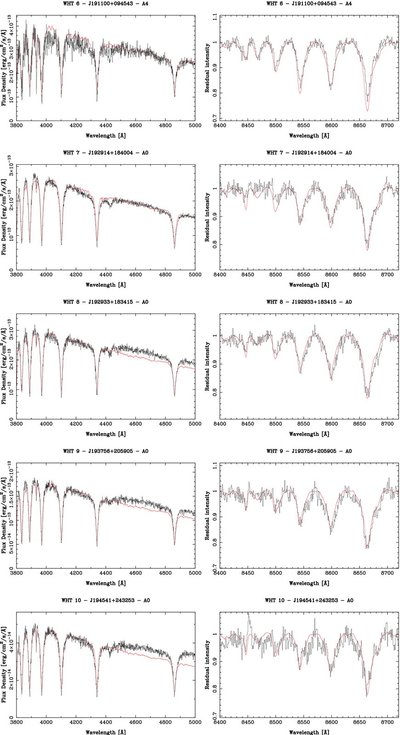
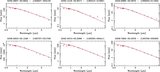
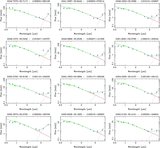
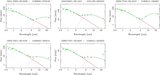
Caption: Figure 3.
WHT ISIS Spectra of IPHAS-selected A-type stars. The dereddened flux-calibrated spectra of the targets (black dotted lines) are shown for the blue spectral region (left-hand panels) and for the red spectral region (right-hand panels), and are compared to the spectra of the A-type spectral standards that provide the best match to their red spectral features (red solid lines). The spectral subtypes of these spectral standards are shown at the top of each plot. All of the plotted spectral standards are luminosity class V dwarfs, except for WHT 4, which is best matched by an A5Ia supergiant spectrum.
Other Images in This Article
Copyright and Terms & Conditions
© 2009. The American Astronomical Society. All rights reserved.