

Image Details
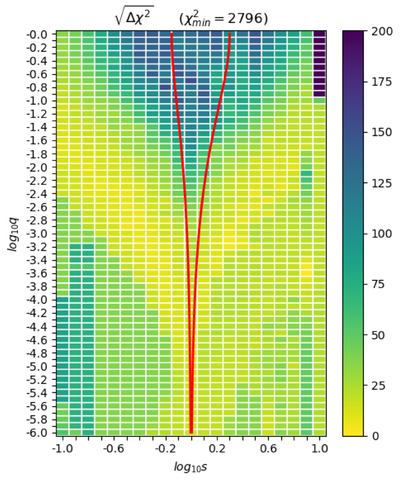
Caption: Figure 6.
Grid search of log mass ratio and log separation for finite-source, binary-lens (FSBL) models of the microlensing event OGLE-2015-BLG-1395, as a guide to what to expect from the Markov Chain Monte Carlo (MCMC) explorations. The color-coding gives the minimized χ2 values. The symmetry of the diagram is due to the well-known close/wide degeneracy coming from the lens equation. The red lines represent the division between the close, resonant and wide caustic topologies (close on the left, wide on the right). Choosing starting points for the MCMC explorations from areas containing local minima results in the best-fit models as described in the text and Table 3. All of the solutions in the valley of local minima lie in the regime of large planets (﹩-4\lesssim \mathrm{log}q\lesssim -2﹩).
Other Images in This Article
Copyright and Terms & Conditions
© 2026. The Author(s). Published by the American Astronomical Society.

