

Image Details
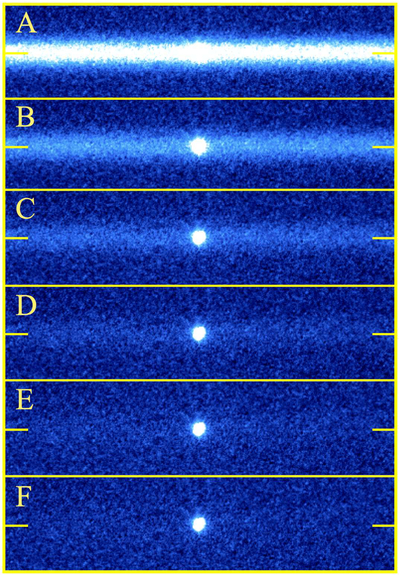
Caption: Figure 6.
Simulated trails on UT 2023 September 24/25 having, from top to bottom, peak surface brightnesses Panel (A): 23.4, (B): 24.1, (C): 24.8, (D): 25.5, (E): 26.2, and (F): 26.9 mag (arcsec)−2. Short horizontal lines to the left and right of each panel show the mid-lines of the digitally added trails. The panels are shown with a fixed stretch. The region shown in each panel is 16″ wide, centered on Bennu.
Other Images in This Article
Copyright and Terms & Conditions
© 2026. The Author(s). Published by the American Astronomical Society.

Copyright ©
2026 Astronomy Image Explorer. All Rights Reserved.
