

Image Details
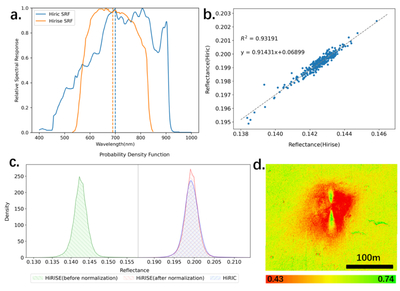
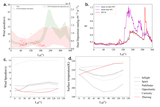
Caption: Figure 2.
Radiometric cross calibration and normalization analysis for HiRIC and HiRISE data. (a) Relative spectral response (SRF) of the two sensors: HiRIC panchromatic band and HiRISE red band. (b) Linear correlation between the HiRISE image (image ID: ESP_073225_2055_RED) and HiRIC image (image ID: HX1-Or_GRAS_HiRIC-CCD2-F_SCI_N_20220316033220_20220316033250_00989_A). (c) Probability density functions (PDFs) of surface reflectance for validating cross-instrument normalization. Green shaded region: raw HiRISE reflectance before correction; red shaded region: HiRISE reflectance after linear normalization; blue shaded region: temporally adjacent HiRIC reflectance. The convergence of reflectance distributions after correction demonstrates the removal of systematic radiometric offsets between HiRISE and HiRIC. (d) Ratio map derived from coregistered pre- and postlanding images of the Zhurong rover. Areas with lower ratio values correspond to surfaces subjected to stronger landing-induced disturbances.
Other Images in This Article
Copyright and Terms & Conditions
© 2026. The Author(s). Published by the American Astronomical Society.

