

Image Details
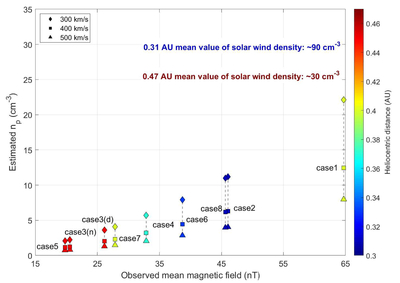
Caption: Figure 5.
Relationship between the 30 minute average upstream magnetic field magnitude BAV R and the inferred plasma number density np for the eight BSD events. For each event, three symbols are plotted corresponding to different assumed solar wind speeds: diamonds (♢) for 300 km s−1, squares (□) for 400 km s−1 (the nominal value used in Table 1), and upward triangles (△) for 500 km s−1. Note that Case 3 is divided into two entries: case3(d) for the dayside portion and case3(n) for the nightside portion of the same orbit. The gray dashed vertical lines connect the three speed-dependent estimates for each case, illustrating the range of possible critical densities under reasonable solar wind speed variations. The color of each symbol indicates the heliocentric distance of the event (see color bar). Horizontal dashed lines (or text labels) mark the mean values of the typical solar wind density at 0.31 au (∼90 cm−3) and at 0.47 au (∼30 cm−3), demonstrating that all inferred critical densities remain far below the ambient solar wind densities at Mercury’s orbit.
Other Images in This Article
Copyright and Terms & Conditions
© 2026. The Author(s). Published by the American Astronomical Society.

