

Image Details
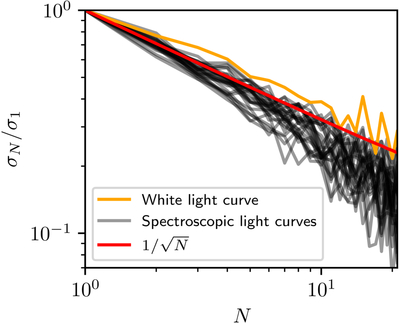
Caption: Figure 5.
Normalized residual rms σN/σ1 between best-fit models and data for the white and spectroscopic light curves from the PACMAN reduction as a function of the number of data points N per bin. The expected normalized residual rms in the absence of red noise (F. Pont et al. 2006) is shown in red.
Other Images in This Article


Show More
Copyright and Terms & Conditions
© 2026. The Author(s). Published by the American Astronomical Society.

Copyright ©
2026 Astronomy Image Explorer. All Rights Reserved.
