

Image Details
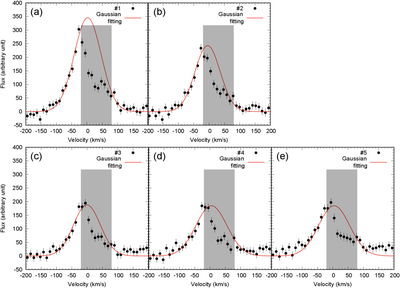
Caption: Figure 2.
Same as Figure 1, but showing the individual Hα spectra of SR 12 c. Panels (a)–(e) correspond to observing sequences #1 to #5, respectively. The red lines represent the results of Gaussian fitting to the spectral wings at −200 km s−1 <v < −20 km s−1 and +80 km s−1 <v < +200 km s−1. The gray regions at −20 km s−1 <v < +80 km s−1 were excluded from the Gaussian fitting. The fitting was performed using gnuplot (http://www.gnuplot.info). Unidentified systematic effects may be present at approximately −175 and +175 km s−1 (see Section 2).
Other Images in This Article
Copyright and Terms & Conditions
© 2026. The Author(s). Published by the American Astronomical Society.

Copyright ©
2026 Astronomy Image Explorer. All Rights Reserved.
