

Image Details
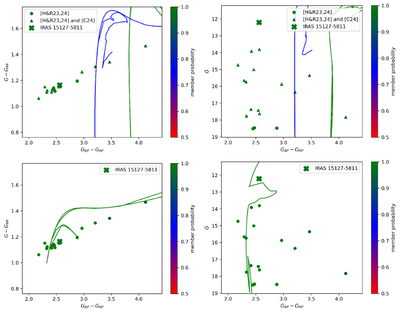
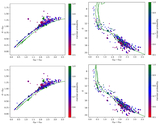
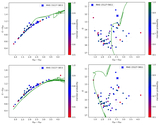
Caption: Figure 3.
CCDs (left) and CMDs (right) for HSC 2686 with best-fitting isochrones; (1st row) green line: using the parameters from H&R and only fitting the metallicity; blue line: using the OC parameters provided by C24. (second row) Fitting all OC parameters with OCFit. The size of the symbols in the CCDs is proportional to the uncertainty in the Gaia G magnitude. Note that the size of IRAS 15127-5811 was scaled up by a factor of 4 for better visibility. The color corresponds to the cluster membership probability.
Other Images in This Article
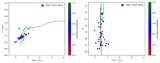
Show More
Copyright and Terms & Conditions
© 2026. The Author(s). Published by the American Astronomical Society.

Copyright ©
2026 Astronomy Image Explorer. All Rights Reserved.
