

Image Details
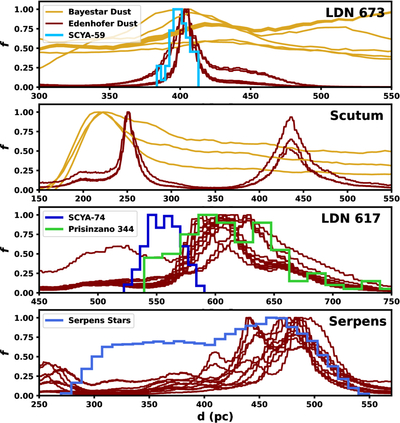
Caption: Figure 4.
Distance profiles of stars and dust for a selection of regions in the Serpens–Aquila Rift. In all panels, the dark red curves show extinction from the G. Edenhofer et al. (2024) dust maps within 0﹩\mathop{.}\limits^{\unicode{x000b0}}﹩25 of the HH object progenitor, the yellow curves show pixels within 0﹩\mathop{.}\limits^{\unicode{x000b0}}﹩1 from the G. M. Green et al. (2019) dust maps, the blue step curves are histograms of distances to various populations from R. Kerr et al. (2023; see legends), and the green curve shows group 344 from L. Prisinzano et al. (2022). All curves are normalized, so the vertical axis f is the fraction of the maximum value. The top panel shows LDN 673, where SCYA-59 member stars from R. Kerr et al. (2023) agree closely with the G. Edenhofer et al. (2024) dust curves, while the G. M. Green et al. (2019) curve roughly aligns but with a broader peak. In the second panel, we show the Scutum region, which is largely free from known stellar populations, but has multiple dust peaks from G. Edenhofer et al. (2024) that the higher-resolution G. M. Green et al. (2019) maps help to disentangle. In the third panel, we show LDN 617, which aligns closely with L. Prisinzano et al. (2022) group 344, and also overlaps with SCYA-74. Finally, in the bottom panel, we show that the dust in Serpens largely aligns with the far edge of the stellar population identified in R. Kerr et al. (2023).
Other Images in This Article
Copyright and Terms & Conditions
© 2026. The Author(s). Published by the American Astronomical Society.

