Image Details
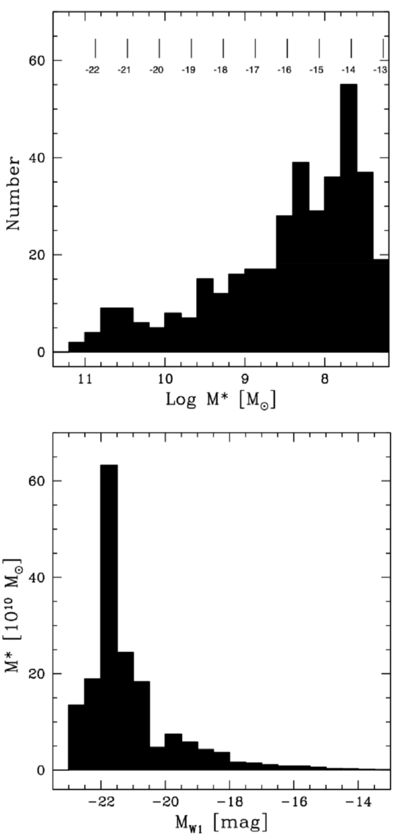
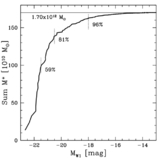
Caption: Figure 6.
Top: histogram of the 1–10 Mpc, MW1 < −13 mag sample in increments of log stellar mass, with corresponding MW1 intervals indicated across the top. Bottom: histogram of stellar mass for the same sample, in units of 1010 M⊙, in intervals of MW1 mag.
Other Images in This Article
Copyright and Terms & Conditions
© 2026. The Author(s). Published by the American Astronomical Society.
Copyright ©
2026 Astronomy Image Explorer. All Rights Reserved.